I started this project with a simple question: how many satellites are up there, and what would it look like if I could see them from where I’m standing?
The idea was to hold up my phone, point it around the sky, and get a sense of the satellites passing overhead. A number in a table is one thing; seeing those objects arranged around you is another. That became Orbitgaze, a browser-based satellite viewer.
It also became an opportunity to explore a few engineering questions I had been interested in: moving expensive calculations off the browser’s main thread, sharing data without constantly allocating new objects, and choosing a projection that feels right when you are looking up at the sky.
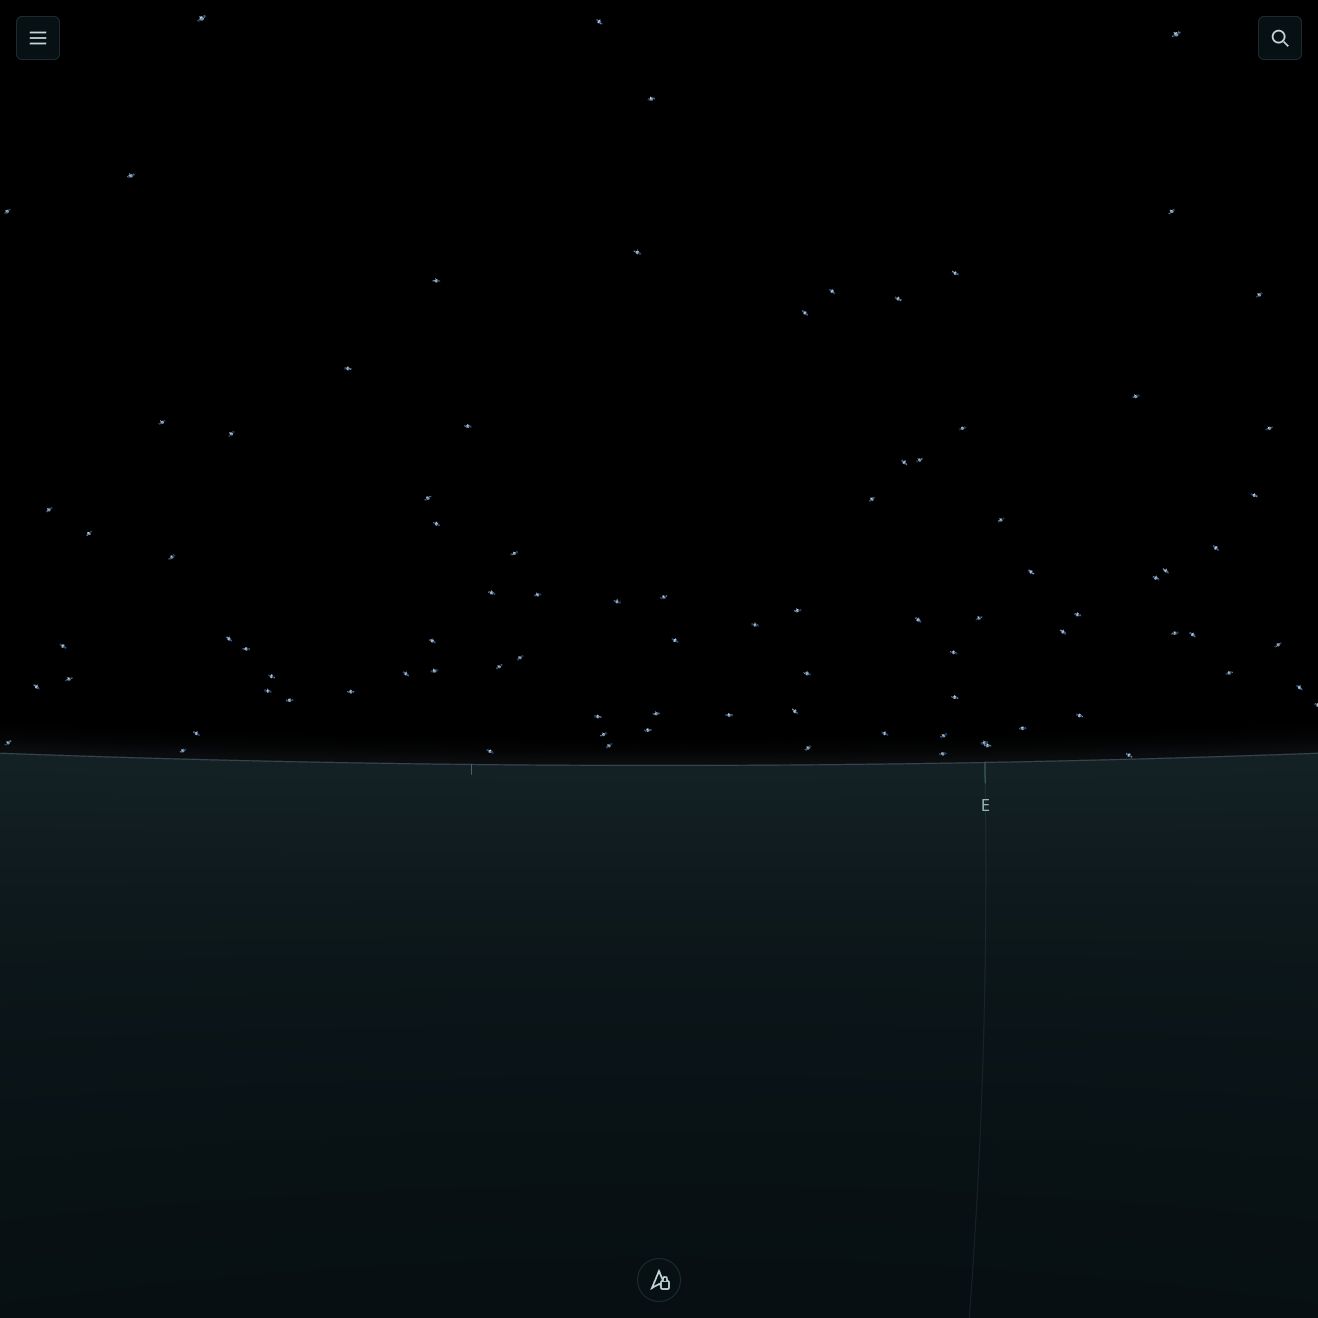
Orbitgaze running in the browser. Satellite markers are deliberately enlarged; this is a visualization of calculated positions, not a prediction of what is visible to the naked eye.
Starting with the observer
I had worked with deck.gl before, mainly for map-based visualizations. It was a natural starting point: it already had layers, camera controls, and support for large datasets. Its first-person view let me place the observer at the center of the scene and look outward, instead of looking down at a map.
The positions come from satellite.js, using orbital data published by CelesTrak. These are orbital elements associated with a reference time, which the library propagates to estimate a satellite’s position at another time. I then convert that position into a direction and distance relative to the observer.
The same calculation also gives me trajectories. Sampling a satellite’s position at a series of times produces the points for a line showing its path across the sky. I do not need a separate mathematical model for the orbit display.
There is some artistic license in how those positions appear. Satellites drawn at their physical size would be too small to see or select. I enlarge the markers and keep a distance-dependent size cue, with limits to keep them usable. I wanted to retain some sense of nearby and distant objects without making the distant ones disappear entirely.
Fetching the data once for everyone
I did not want every visitor to download the same dataset directly from CelesTrak. The app runs on Cloudflare, where a scheduled Worker retrieves the data and stores a shared snapshot in Workers KV. Visitors read that snapshot through the app’s own API.
The current schedule attempts a refresh every two hours. If the source returns an error, the service keeps the last good snapshot and pauses further source requests until the issue is investigated. The interface shows the data’s age and warns when updates are stale or paused.
That reduces redundant requests and lets the visualization continue through an upstream outage. It does not make old orbital data more accurate: the displayed positions are still estimates based on the available elements.
Keeping the main thread free
One of my main reasons for building the app was to experiment with browser multithreading. The dataset I was working with contained roughly 16,000 satellites. Recalculating all those positions while also handling camera movement and rendering would put too much work on the main thread.
My target was a responsive view at 60 frames per second. I moved the orbital calculations into a Web Worker, leaving the main thread to handle interaction and drawing. Moving the work alone, however, does not solve the cost of passing thousands of positions back to the renderer.
For that, I used a SharedArrayBuffer with typed-array views. The worker creates the buffer and shares it with the main thread. A small header contains a revision counter, followed by a fixed slot for each satellite’s east, north, and up coordinates. A satellite keeps its slot even when it drops below the horizon; a sentinel value marks it as hidden.
That layout avoids rebuilding an array of JavaScript objects each time the positions change. The worker writes into the existing slots and increments the revision counter with Atomics. The renderer checks the counter and updates its GPU attribute when new data is available. The GPU upload still happens, but the application avoids repeatedly copying or reallocating the position array on the CPU.
The buffer remains stable during ordinary position updates. When a fresh orbital dataset arrives, the worker publishes a new buffer together with its matching satellite metadata, so slot indices and satellite identities stay aligned.
I also separated the calculation rate from the drawing rate. The current worker divides the satellites into eight chunks and updates one chunk on each timer tick. The renderer can keep drawing while individual positions update less frequently. For this view, a position being a few frames old is much less noticeable than the camera stuttering as you drag it.
Letting React handle the interface
React is useful for the surrounding controls, search, and satellite details. I did not want every position update to become a React state update, though.
I put the renderer behind an imperative interface, with its lifetime managed by an effect. A requestAnimationFrame loop checks the shared-memory revision and draws the scene. React still manages the application interface, while the continuous position updates take a more direct route to the renderer.
I first used this approach with deck.gl and kept it when I changed rendering libraries. The useful boundary was between the interface and the continuously changing scene, regardless of which library drew it.
Finding a projection that fits the sky
As the view developed, I noticed something that bothered me on wide screens. Satellites appeared increasingly spread out toward the edges, and their apparent size changed in a way that made the scene feel uneven.
This came from the rectilinear perspective projection. It preserves straight lines, but stretches the view toward the edges at wide viewing angles. That tradeoff is familiar in a conventional 3D scene; it felt less natural for a viewer whose subject is the sky surrounding an observer.
With help from coding agents, I explored stereographic projection. Its distortion increases more gently away from the center, which suited this view better. It does not preserve all distances or remove distortion. It preserves local angles, and its treatment of the horizon introduces an obvious visual tradeoff: as you tilt the view, the horizon can curve. The projection mathematics explains why straight-looking features on the sky do not necessarily remain straight on the screen.
I preferred that tradeoff. The curved horizon felt unusual at first, but the movement of satellites across the sky was more consistent with the experience I wanted.
Changing the projection affected much more than the satellite markers. Orbit paths, the ground, labels, and selection all needed to agree about where things appeared. Picking an object with the mouse is only useful if the selection calculation matches the image on the screen.
Moving from deck.gl to Three.js
My first approach was to adapt deck.gl with custom shaders and layer extensions. As more of the scene needed the new projection, the integration accumulated overrides and shader replacements. The library had helped me get started quickly, but I was now spending more effort adapting its assumptions to this particular view.
At that point, I asked the coding agents to help refactor the renderer into Three.js. The rewrite was simpler than I had expected and reduced the amount of code. Custom shaders handle the sky projection, and CPU-side picking projects satellite positions into screen space using matching mathematics.
Three.js still needs custom projection code. What changed was how directly I could express it. With the app’s requirements already clear, I could build a small renderer around those requirements and keep the worker, data flow, and interface largely intact.
The sequence mattered. By the time I changed libraries, I already had a working reference for the camera behavior, trajectories, selection, and overall appearance. That gave the agents a concrete target, and it gave me something to compare against while reviewing the result.
I started out wanting to see the satellites around me. Along the way, the project became an exercise in finding the right boundaries: between calculation and rendering, between React and the scene, and between a library’s defaults and the experience I was trying to build. Developing it incrementally made those boundaries easier to see.